
Online Tutorial #8: How Do You Perform a Price-Implied Expectations (PIE) Analysis?
In the previous online tutorials, we defined and explained how to calculate and project various Operating Value Drivers and Other Value Determinants:
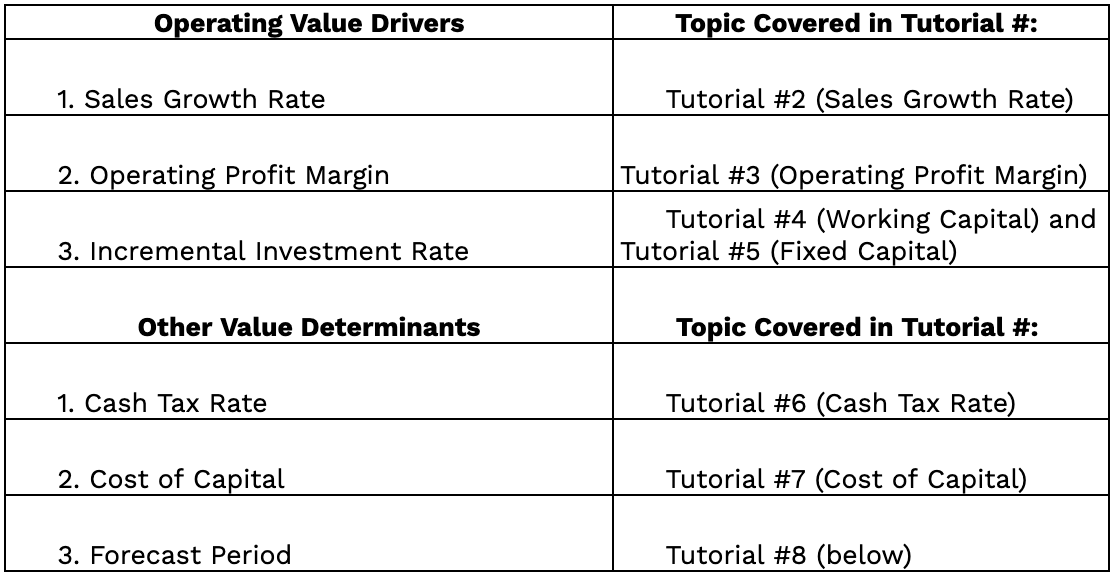
This session puts it all together and uses those value drivers and determinants to explain the mechanics of the PIE analysis. We perform this analysis in four steps:
1. Calculate Free Cash Flow
2. Value Non-Operating Assets
3. Calculate Market Value of Equity
4. Determine the Market-Implied Forecast Period
As with the previous tutorials, we will use Domino's Pizza. (as of September 2020) as a case study. Readers who want to perform the PIE calculations may wish to download the accompanying spreadsheet.
In the calculations to follow, we will use the Operating Value Drivers and Other Value Determinants that we have projected previously.
Step 1: Calculate Free Cash Flow
All three Operating Value Drivers and one Other Value Determinant--the Cash Tax Rate--affect Free Cash Flow:
We calculate Free Cash Flow for any given year by performing the following five steps:
A. Calculate Sales
B. Calculate Operating Profit
C. Calculate and Subtract Cash Taxes
D. Calculate and Subtract Incremental Investment
E. Calculate Free Cash Flow
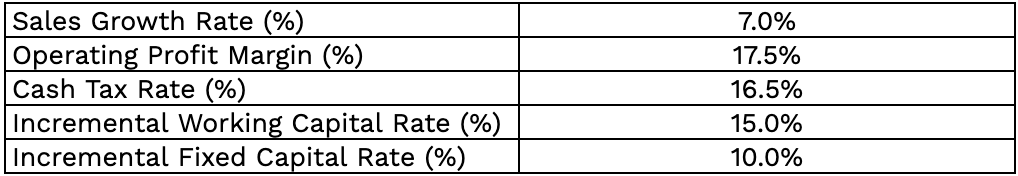
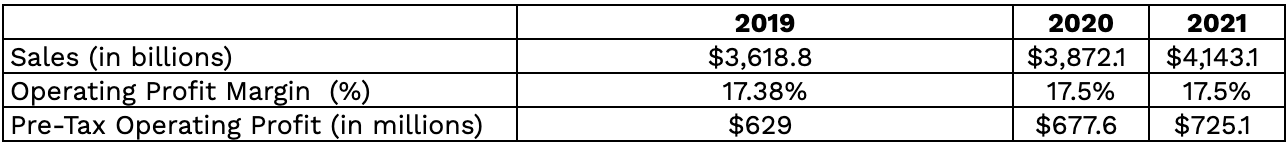
A. Calculate Sales. For historical data, we use actual Sales figures as a starting point. For projected data, we apply the Sales Growth Rate (%) to historical Sales figures to project future Sales. For example, Domino's 2019 historical Sales amounted to $3.619 billion. With a 7% projected Sales Growth Rate, this would translate into $3.9 billion in Sales in 2020 and $4.1 billion in 2021.

B. Calculate Operating Profit. We multiply Sales by the Operating Profit Margin (%) to obtain pre-tax Operating Profit. The historical Operating Profit Margin in 2019 equaled 17.38%. So, pre-tax Operating Profit in 2019 amounts to 17.38% times $3.619 billion in Sales, or $629 million. Using our projected Operating Profit Margin of 17.5%, projected Operating Profit in 2020 amounts to 17.5% times $3.87 billion in Sales, or $677.6 million. Operating Profit in 2021 amounts to 17.5% times $4.14 billion in Sales, or $725 million.
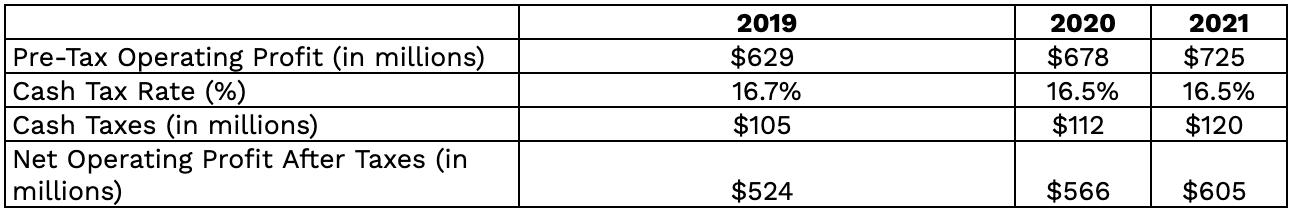
C. Calculate and Subtract Cash Taxes. We then take the company's pre-tax Operating Profit and multiply it by the Cash Tax Rate (%). We subtract the amount of Cash Taxes from pre-tax Operating Profit to obtain Net Operating Profit after Taxes (NOPAT). In 2019, Domino's had a Cash Tax Rate of 16.7%, meaning the company's cash taxes were equal to $105.2 million, 16.7% times its pre-tax Operating Profit of $629.4 million. NOPAT was therefore $524 million in NOPAT. Applying our projected 16.5% cash tax rate to our 2020 and 2021 pre-tax Operating Profit estimates results in NOPAT of $566 million and $605 million, respectively.
D. Calculate and Subtract Incremental Investments. To calculate incremental investments for any given year, we multiply the projected increase in sales by the Incremental Working Capital Rate and add this to the projected increase in sales times the Incremental Fixed Capital Rate. For example, in 2019, Domino's generated $6 million in cash from Incremental Working Capital--equal to the Incremental Working Capital Rate of -3.1% times the increase in sales of $186 million--and $26 million in Incremental Fixed Capital--equal to the Incremental Fixed Capital Rate of 13.8% times the increase in sales of $166 million. This amounts to $20 million in Total Incremental Capital in 2019.
Applying our projected Operating Value Drivers into the future yields an estimate of $63 million and $68 million in Total Incremental Capital for 2020 and 2021.

E. Calculate Free Cash Flow. We are now ready to calculate Free Cash Flow, which is simply Net Operating Profits After Taxes minus Total Incremental Capital:

Step 2: Value Non-Operating Assets
Once we have calculated projected Free Cash Flows into the future, we need to include the value of Non-Operating Assets and Debt.
A. Calculate Value of Non-Operating Assets. Excess cash and marketable securities largely account for the value of non-operating assets. As of September, 2020, Domino's had approximately $392 million in total cash and marketable securities, or approximately $9.95 per share.
B. Calculate Value of Debt and other Liabilities. To calculate the total value of economic liabilities, we add the following:Debt. Domino's debt was $4.17 billion in September, 2020. There were no other meaningful liabilitiesDomino's economic liabilities total $4.17 billion, or $106 per share.
C. Calculate Net Value of Non-Operating Assets and Debt. We add Domino's Excess Cash of $392 million and subtract the value of Domino's debt of $4.17 billion to corporate value.
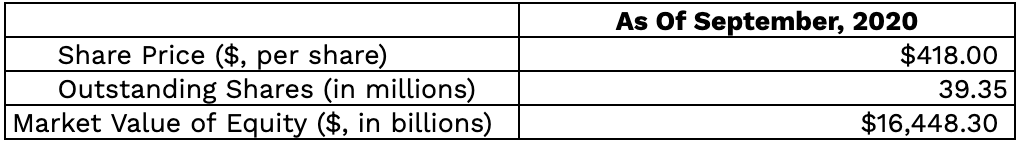
Step 3: Calculate Market Value of Equity
To calculate the market value of equity, we multiply the share price by the number of outstanding shares:
Step 4: Calculate Market-Implied Forecast Period
We are now ready to calculate the Market-Implied Forecast Period. To do this, we determine the present value of Domino's Free Cash Flows (calculated in Step 1), using the company's Weighted Average Cost of Capital of 5.35% (calculated in Online Tutorial #8). We then extend the Forecast Period as far as necessary to match the current stock price. Our residual value is a perpetuity with inflation and assumes a 1.6% inflation rate.
We estimate Domino's value at the end of 2020 to be $285 per share, and it increases each year until it reaches its $418 stock price in 2027, the eighth year (see spreadsheet). The market-implied forecast period is therefore eight years. The spreadsheet also automatically calculates the Market-Implied Forecast Period in cell C31 of worksheet "Price Implied Expectations."
This concludes our Tutorial on calculating Price-Implied Expectations.
Please note that you can use this same spreadsheet to perform sensitivity analyses to see the valuation impact of scenarios with various Operating Value Drivers and Other Value Determinants—as explained in Chapters 6 and 7.